|
|
The heart is a muscular pump that circulates blood through an animal's body. A person's heart is typically about the same size as their fist. The heart consists of four chambers. The upper heart is the atria (two atrial chambers) and the lower part is the ventricles (two ventricular chambers). The heart is mainly comprised of a specialized type of striated muscle, with properties that function somewhat differently than skeletal muscle. Heart cells are connected by gap junctions that allow ions to flow from one cell to another, allowing for rapid spreading of depolarization. A collection of heart cells connected in this way constitutes a syncytium. The heart is composed of two syncytiums: an atrial syncytium and a ventricular syncytium.
The muscle composing walls of the heart is call the myocardium. The two ventricles are separated by the ventricular septum, which is thick & muscular toward the bottom, and thick & fibrous at the top. Under the myocardium is the endocardium, which lines the chambers of the heart, and which is mainly composed of epithelial cells. The pericardium is a double-walled sac that contains the heart and the roots of the great vessels. The outer wall of the pericardium is composed of dense connective tissue. The portion of the inner wall of the pericardium that is in contact with the heart (but not in contact with the great vessels) is the epicardium. The epicardium contains the blood vessels supplying blood to heart muscle (the coronary arteries) as well as nerve fibers.
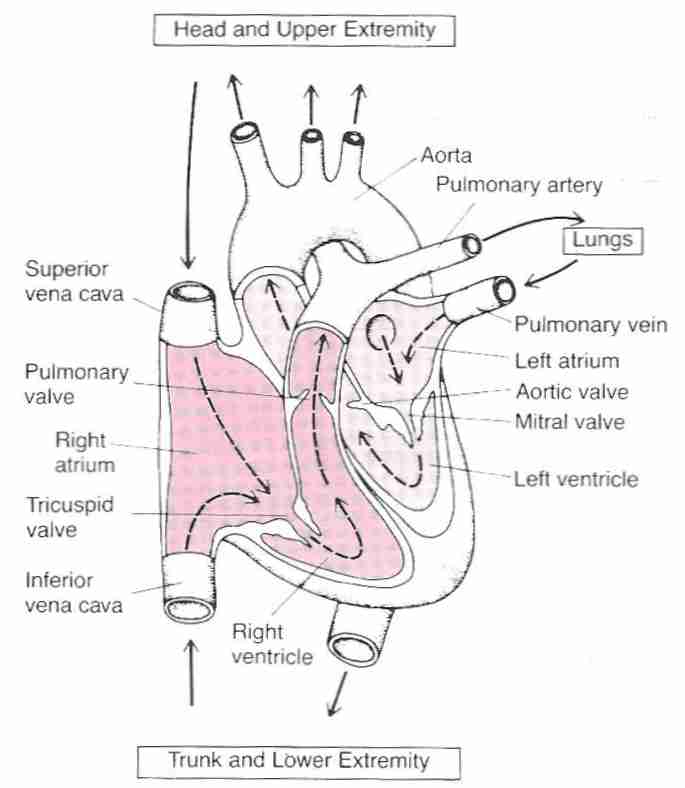
The veins of the body terminate in two great vessels that empty into the
right atrium: the superior vena cava (from the upper body) and
the inferior vena cava (from the lower body). Blood exits
the heart through the pulmonary artery (which takes
unoxygenated blood to the lungs from the right ventricle) and
through the aorta (which distributes oxygenated blood
to the body from the left ventricle). Oxygenated blood from
the lungs enters the left atrium from the pulmonary vein.
The pulmonary artery is the only artery that carries unoxygenated
blood and the pulmonary vein is the only vein that carries
oxygenated blood.
|
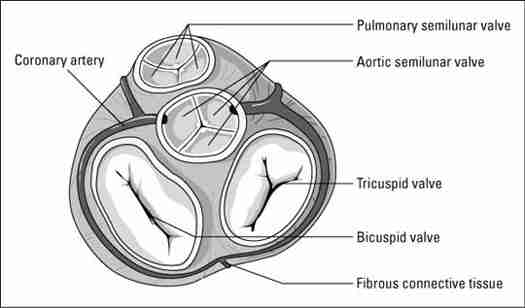
There is a one-way flow of blood from the atria to the ventricles. Reverse flow is prevented by the A−V valves: the tricuspid valve (having 3 flaps or "cusps") on the right and the mitral (bicuspid) valve on the left. The inner flaps of the A−V valves have connective tissue attachments ("heart strings") from muscular mounds on the ventricles that prevent the flaps from bulging too much into the atria during contraction of the ventricles. Flow of blood back to the ventricles following ejection of blood from the ventricles is prevented by the semilunar valves: the pulmonary valve on the right and the aortic valve on the left, each of which have three flaps shaped somewhat like half-moons.
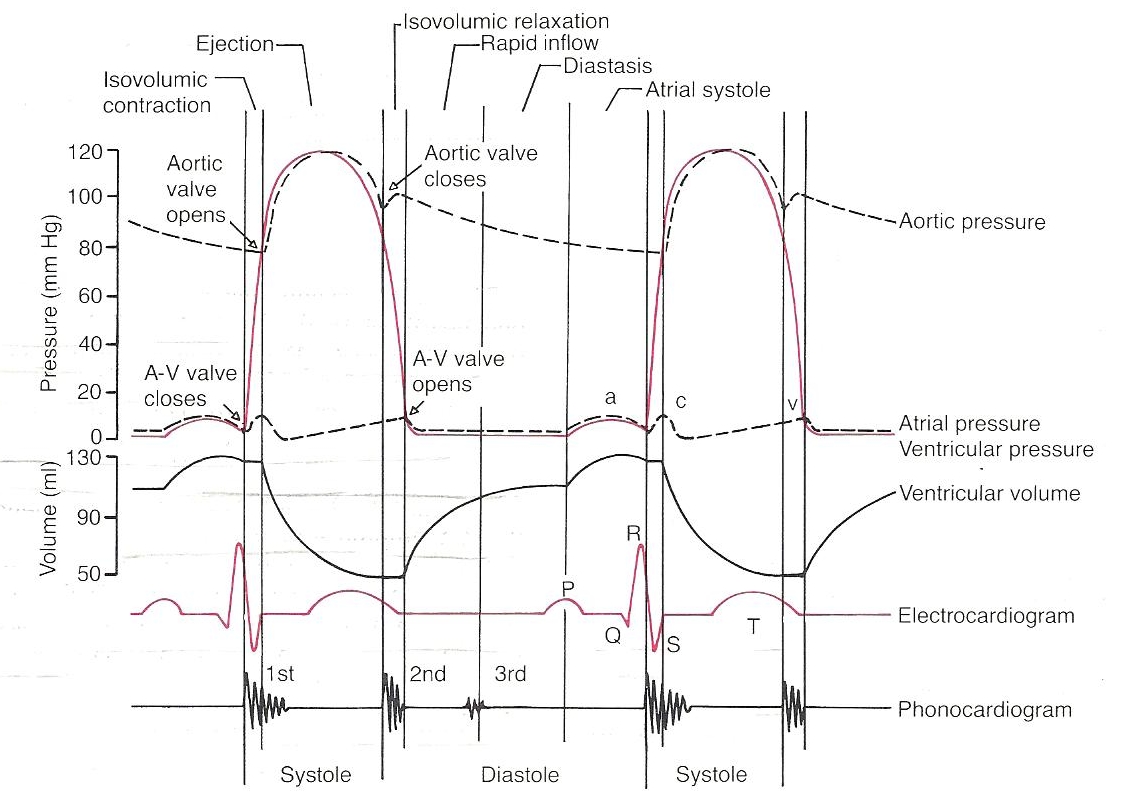
The first heart sound ("lubb") occurs during ventricular contraction when the mitral valve is closing (beginning of systole), and the second heart sound ("dupp") occurs during ventricular relaxation when the aortic valve is closing (beginning of diastole). The closing of the valves on the right side of the heart are not so easy to hear. Valves that cannot close completely can cause murmurs associated with regurgitation of blood. But murmurs are not necessarily an indication of valve pathology.
The openings to the right and left
coronary arteries (which
supply blood to the heart) are in the aorta just beyond the cusps
of the aortic semilunar valve. The right coronary artery supplies
the right atrium, right ventricle, and most of the posterior
surface of the left ventricle with blood. The left coronary
artery branches into the left anterior descending artery
(which supplies the anterior surface of the left ventricle)
and the circumflex artery (which supplies the left atrium
and parts of the left ventricle).
The heart pumps blood in a two-step process. The atria pump blood into the ventricles and then the ventricles pump blood out of the heart. Chambers of the heart fill with blood during a relaxation phase (diastole) and eject blood during a contraction phase (systole). Atrial systole precedes ventricular systole. The systole and diastole of the left ventricle correspond to the systolic (high pressure) and diastolic (lower pressure) phases of blood pressure in the body.
The right atrium pumps blood from the body into the right ventricle. The right ventricle pumps blood into the lungs. The left atrium pumps blood from the lungs into the left ventricle. The left ventricle pumps blood to the body through the aorta. This cycling of blood by the heart is called the cardiac cycle. A couple of YouTube animations illustrate the cardiac cycle:
The left ventricle has the most powerful musculature insofar as it must pump blood into the entire body. For the left ventricle the cardiac cycle can be described in four phases:
|
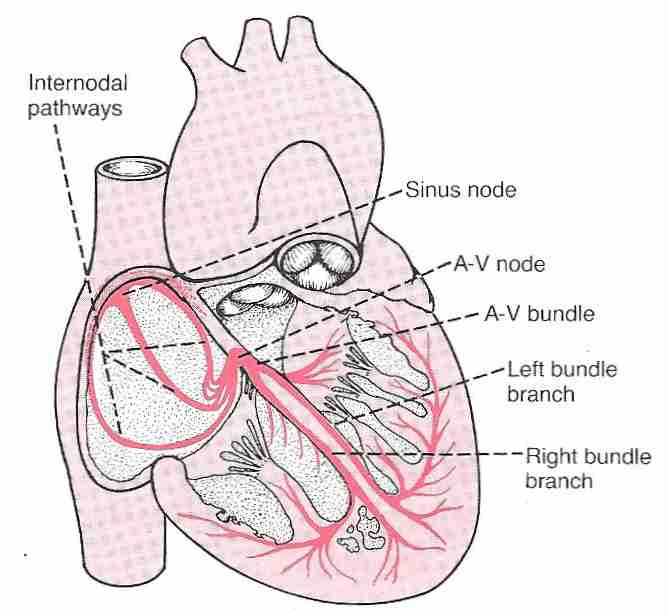
Depolarization and contraction of cardiac muscle is preceded by depolarization of the cardiac nerve bundles. Depolarization of the heart is initiated at the sinus node (the sinoatrial node) located on the right atrium. Depolarization is transmitted through the A−V node (Atrio-Ventricular node), the A−V bundle (the Bundle of His), and then through the ventricles by the Purkinje fibers.
The cardiac cycle is initiated in the sinus node in the atrium, which causes contraction of the atrial syncytium. The depolarization is delayed at the A−V node before passing to the A−V bundle and splitting into a right branch bundle and a left branch bundle, sending depolarization to the muscle of the right ventricle and the left ventricle, respectively. The A−V node delay prevents the atria and ventricles from contracting at the same time. During ventricular contraction the wave of depolarization in the cardiac muscle moves from the endocardium to the pericardial surface through the myocardium. Unlike cardiac cells which have mechanical (contractile) function, the cardiac cells having an electrical conduction function not only conduct electrical impulses, but spontaneously generate impulses. In a normal heart it is the cardiac cells of the sinus node that have the highest rate of spontaneous impulse generation, which makes the sinus node the ultimate pacemaker of the electrical system of a healthy heart.
Acetylcholine released from parasympathetic nervous system fibers (vagus nerve) slows the discharge rate at the sinus node, and slows the conduction rate through the A−V node. Release of norepinephrine from the sympathetic (adrenergic) nervous system has the opposite effect on the heart: increasing heart rate, force of contraction and blood pressure. Beta−1 adrenergic receptors in the heart increase heart rate and contractility. Alpha adrenergic receptors constrict peripheral blood vessels thereby increasing blood pressure.
Cardiac output is defined to be the amount of blood that the heart pumps in one minute — typically four to eight liters per minute. Cardiac output equals stroke volume times heart rate. Typically it takes one minute for a red blood cell to travel from the heart, through the arteries, capillaries & veins, and back to the heart. By age 70 cardiac output can have declined by about one-third in many people. (The myocardium can also become more irritable with aging, leading to irregular heartbeats).
Normal heart rate for an infant is in the range of 100 to 160 beats per minute. Heart rate typically becomes slower as children get older. For teenagers and adults, 60 to 100 beats per minute in considered normal, with slower rates called sinus bradycardia. Sinus bradycardia can be due to hypothyroidism, hypokalemia, beta-blocker drugs or other drugs/pathologies, or it can be normal for athletes or people who exercise. About one-third of normal people under age 25 have heart rates less than 60 beats per minute. Nearly all athletes have resting heart rates below 60 beats per minute [AMERICAN JOURNAL OF EMERGENCY MEDICINE; Wu,J; 24(1):77-86 (2006) and BRITISH JOURNAL OF SPORTS MEDICINE; Corrado,D; 43(9):669-676 (2009)]. Sinus tachycardia generally designates heart rates in the 101 to 180 beats per minute range. Hyperthyroidism, caffeine, and nicotine — as well as fear & anxiety — are among the possible causes of high heart rates.
Depolarization of the heart can be monitored with three electrodes attached to the body: one on each arm and one on the left leg. Depolarization spreads from the right atrium (corresponding to the electrode on the right arm) to the left ventricle (corresponding to the electrode on the left leg). The electrode on the left arm is neutral. Additional electrodes provide more sensitive monitoring of depolarization (see section IV).
![[ Normal electrocardiogram ]](./NormECG.jpg)
|
![[ Normal electrocardiogram ]](./NormECG2.jpg)
|
Potential differences between electrodes are recorded on a chart known as an electrocardiogram. Cardiography paper is divided into small squares that are one millimeter on each side, and large squares which contain five small squares on each side. Because cardiography paper moves at 25 millimeters per second, a width of five large blocks contains one second of waveforms.
Potential differences between electrodes record a spreading depolarization. Complete depolarization or complete polarization is a flat line (midline, zero millivolts). Five waves corresponding to upward or downward deflections from zero millivolts on an ECG chart are designated alphabetically as P,Q,R,S, and T waves. Sometimes a U wave (of similar shape to a T wave, but of lower amplitude) follows the T wave. A U wave is usually seen in people with low heart rates, and is rarely seen when heart rate is high. The Q,R, and S waves are grouped together as the QRS complex. Depolarizations and repolarizations corresponding to these waves can be summarized by:
Normal T waves are slightly skewed to the right, rather than being completely symmetrical. U waves are believed to be a delayed component of repolarization associated with the T wave [CLINICAL CARDIOLOGY; Correale,E; 27(12):674-677 (2004)].
Atrial repolarization is obscured by the more powerful QRS complex. The waves of the QRS complex can be described in more detail:
|
In conditions of hypothermia, a J wave may occur at the end of the QRS complex. The end of the QRS complex (beginning of the ST−segment) is called the J point, a point of zero voltage associated with the exact time when the wave of depolarization has completed its passage through the heart.
The Q wave can be enlarged by myocardial infarction. The R−wave can be enlarged (higher or wider) if the ventricle is enlarged. The QRS complex is prolonged if the Purkinje fibers are blocked because a depolarization carried through ventricular muscle has a much slower conduction velocity.
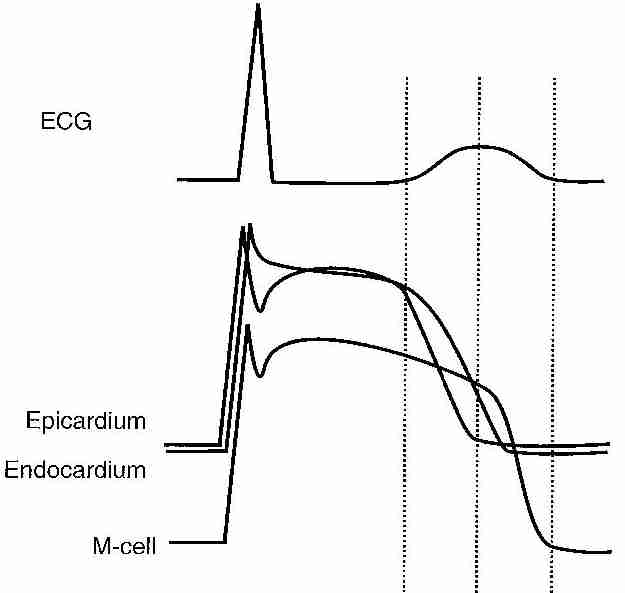
Heart waveforms seen in an electrocardiogram are the sum resultant of a variety of electrical heart currents. For the QRS wave, it is the electrical activity of the left ventricle that dominates. The QRS wave seen is a 20% residue of cardiac electrical activity, 80% of which has been canceled-out by counterveiling currents. It seems contradictory that depolarization of the left ventricle would give positive R waves, whereas repolarization of the left ventricle gives T waves that are also positive. The explanation is that the T wave displayed is the resultant of repolarization of the epicardium, the endocardium and the myocardium (M-cells). Deploarization occurs from endocardium to epicardium, whereas repolarization is in the reverse direction. Epicardial cells have completed repolarization by the middle of the T wave, and the end of the T wave corresponds to the completion of repolarization of the M-cells.
Video animation of the relation between electrophysiology, electrocardiogram and heart physiology.
|
Electrocardiography is based on the fact that depolarization in heart muscle induces electric currents in overlying skin. Electrocardiography was invented at the beginning of the 20th century by the Dutch physician/physiologist Willem Einthoven. Although EKG abbreviates the Dutch word for ElectroCardioGraphy, the English abbreviation ECG is now the abbreviation most commonly in use.
Einthoven used a three-lead system — the standard limb leads — to which has been added three augmented limb leads and six chest (precordial) leads in the modern 12−lead ECG. The term "lead" can be confusing insofar as the standard limb leads are bipolar (measure the potential difference between two electrodes) whereas the others are unipolar (single electrode). The standard limb leads are:
Note that the left arm is positive relative to the right arm and negative relative to the left leg. There is redundancy in using these three bipolar leads insofar as the voltage recorded at Lead II is the sum of the voltages of the other two leads (I + III = II).
A positive waveform (positive voltage) is recorded when depolarization flows from a negative electrode to a positive electrode. For this reason, Lead II typically gives the canonical ECG patterns because the flow of depolarization from negative electrode (right arm) to positive electrode (left leg) matches the typical alignment of the heart in the chest: sloping downward toward the left side of the body.
Leads I, II, and III give a view of the heard called Einthoven's triangle, that divides a 360º circle centered on the heart into three depolarization axes separated by 120º. Adding the three augmented limb leads divides the heart into six depolarization axes separated by 60º. The augmented limb leads are:
| hexaxial system |
|---|
![[ T<sub>3</sub> (triiodothyronine) ]](hexaxial.jpg)
|
Note that a = augmented, V = Voltage, and the final letter designates Right or Left arm, or the left leg (called the left Foot because the letter L was already used by the Left arm). Since the 1960s it has become common practice for electrodes of both standard & augmented limb leads to be placed at locations on the torso (trunk) of the body toward the limbs rather than on the limbs themselves.
Including both positive & negative directions of depolarization of both the standard & augmented limb leads gives a 360º circle divided into twelve 30º sections that is called the hexaxial reference system. Lead I (pointing toward the left arm) is taken as the reference for 0º lead orientation, with increasing positive values in a clockwise direction to 180º and increasing negative values in a counterclockwise direction such that −180º is the same orientation as +180º.
Although Lead II, with an orientation of about 60º is the most typical orientation of an axis pointing from atria to ventricles, it is not abnormal for heart orientation to be in the range of −30º to +110º — which can make Leads aVL, AVF, or III rather than Lead II the primary indicator of normal cardiac depolarization. Thinner people tend to have a more vertical heart orientation.
The 360º hexaxial reference system defines what is called the frontal plane of ECG monitoring — a view of the heart from the front. To provide a view through the horizontal plane — viewing the heart as if the body was sliced horizontally through the middle of the chest — six additional "unipolar" chest (precordial) leads (designated V1 to V6) are placed on positions of the left rib cage forming a quarter-circle around the heart. A quarter-circle on the right rib cage can be used when it seems more important to monitor the right ventricle rather than the left ventricle. At birth, T waves are normally inverted on all precordial leads, but by age 10 only V1 ahd V2 have inverted T waves.
Although Lead V1
typically gives inverted QRS waves (much like Lead aVR),
it is particularly useful to monitor ST−segment changes
and ventricular arrhythmias. Leads V2 to
V4 show particularly abnormal Q waves
and ST−segments when there is blockage of the left
main coronary artery. ST−segment depression in
Leads V2 & V3 can be more
specific to occlusion of the circumflex artery (a branch
of the main left coronary artery). The U wave is most
prominent in Leads V2 & V3,
possibly because these leads are closer to the heart and
have less interference from other organs or
tissues [CIRCULATION; Gerson,MC; 60(5):1014-1020 (1979)].
| limb lead axes (frontal plane) | precordial axes (horizontal plane) | precordial electrodes |
|---|---|---|
![[ limb lead axes ]](frontal.jpg)
|
![[ precordial axes ]](horizontal.jpg)
|
![[precordial electrodes ]](V1V6.jpg)
|
The ST−segment is a period of diastole between the end of systole to the beginning of repolarization of the ventricles. When the ST−segment is normal it is a time when no depolarization or repolarization is occurring, and is thus a time of zero potential (flat line at zero). Deviation (elevation or depression) of the ST−segment from the baseline is the most common use of ECG for diagnosis of ischemia or infarction — with the baseline usually defined by the TP−segment. Extreme ST−segment depression or elevation in multiple leads generally indicates severe ischemia. Ischemia or trauma may cause part of the heart to remain partially or totally depolarized all of the time — resulting in a potential difference between the pathologically depolarized tissue and the normally polarized tissue (ST−segment shift). Blood flow may be sufficient to maintain life in the depolarized tissue, although insufficient to result in repolarization. Myocardial ischemia can result from increased oxygen demand (demand ischemia, such as is associated with exercise or smoking) and/or reduced oxygen supply (supply ischemia, such as is associated with anemia or a blocked coronary artery).
| ST−segment elevation | ST−segment depression |
|---|---|
![[ ST−segment elevation ]](elevation.jpg)
|
![[ ST−segment depression ]](depression.jpg)
|
ST−segment elevation does not necessarily indicate abnormality, but it can suggest myocardial injury, such as ventricular aneurism or myocardial infarction. Pericarditis can cause ST−segment elevation in all leads. Most athletes have ST−segment elevation characterized by an upward concavity in the initial portion of the ST segment [AMERICAN JOURNAL OF EMERGENCY MEDICINE; Wu,J; 24(1):77-86 (2006)]. Acute transmural ischemia (injury going through the entire heart wall) typically causes ST−segment elevation, often associated with high amplitude T waves. ST−segment elevation and large T waves are most often seen in the precordial leads, but may also be seen in leads I, II, III and aVF if the inferior wall is ischemic.
ST−segment depression does
not necessarily accompany myocardial ischemia or indicate abnormality.
ST−segment depression is often seen when myocardial ischemia
exists, but can give many false
positives [AMERICAN HEART JOURNAL; Kalaria,VG; 135(5 Pt 1):901-906
(1998)]. A study of patients with coronary
artery disease showed that 66% of ischemic chest pain
episodes were not accompanied by ST−segment depression,
and only 15% of ST−segment depression events
were associated with chest pain (although painful
ischemia is much more closely coupled with
ST−segment depression during high levels of
physical activity) [AMERICAN HEART JOURNAL; Krantz,DS; 128(4):703-712 (1994)].
Changing body positions, hyperventilation, or drinking cold water
causes slight ST−segment depression and T wave
inversion in many normal subjects. Nonetheless,
ST−segment depression can suggest
that myocardial ischemia is delaying the process of
ventricular repolarization, especially if the depression
is horizontal or downsloping. Persons with
left ventricular hypertrophy typically
have ST−segment depression followed by an
inverted T wave. Echocardiography allows for more
precise evaluation of left ventricular size and function.
Hypokalemia causes
ST−segment depression, flattened T waves,
and prominent U waves that can be
larger than the T waves. Ischemia that does not affect
heart tissue from wall-to-wall ("subendocardial
ischemia", ischemia that does not reach to the
endocardium) tends to result
in ST−segment depression [CIRCULATION; Mirvis,PM; 73(2):365-373 (1986)].
ECGs showing ST−segment depression in the absence of
exercise have been shown to be associated with a
two-fold to four-fold increase in cardiovascular
mortality [JOURNAL OF THE AMERICAN MEDICAL ASSOCIATION; Daviglus,ML;
281(6):530-536 (1999) and JOURNAL OF THE AMERICAN COLLEGE
OF CARDIOLOGY; Okin,PM; 45(11):1787-1793 (2005)].
| Subendocardial ischemia ST−segment depression |
Transmural ischemis ST−segment elevation |
|---|---|
![[ Subendocardial ischemia<br>ST−segment depression ]](./SubEndo.jpg)
|
![[ Transmural ischemis<br>ST−segment elevation ]](./TransMur.jpg)
|
J point depression and a steep upsloping ST segment is normal during maximum exercise. But early onset of ST−segment depression during exercise can be highly indicative of coronary artery disease. ST−segment depression that is only associated with exercise is less predictive of cardiovascular disease (many false positives) than ST−segment depression not associated with exercise [CIRCULATION; Gianrossi,R; 80(1):87-98 (1989)]. The sensitivity of ST−segment depression to disease in exercise increases with the severity of disease [CIRCULATION; Kligfield,P; 114(19):2070-2082 (2006)]. The test outcome of an ECG taken during exercise (treadmill, bicycle) is dependent upon when the test is stopped, although exercise duration itself is not a useful parameter.
Upsloping ST−segment depression is usually not due to a disease condition. In an exercise stress-test study of asymptomatic middle-aged subjects, downsloping or horizonal ST−segment depression greater than one millimeter was predictive of myocardial infarction or cardiac arrest within eight years, but upsloping or horizontal ST−segment depression less than one millimeter were not [CIRCULATION; Rywik,TM; 106(22):2787-2792 (2002)]. The predictive value of upsloping ST−segment depression increases with the depth of the depression [AMERICAN JOURNAL OF CARDIOLOGY; Sansoy,V; 79(6):709-712 (1997)]. In exercise stress testing of mostly coronary artery disease patients, large or moderate reversible ischemic area was seen in 96% of patients with downsloping ST−segment depression, 80% of patients with horizontal ST−segment depression, and 54% of patients with downsloping ST−segment depression. Large reversible ischemic area was seen in 62% of patients with downsloping ST−segment depression, 26% horizontal, and 20% upsloping [ANNALS OF NONINVASIVE ELECTROCARDIOLOGY; Polizos,G; 11(3):237-240 (2006)]. In addition to area, intensity of ischemia & intraventricular conductance also affect ST−segment depression [CIRCULATION; Kligfield,P; 114(19):2070-2082 (2006)].
Correlation of ST−segment depression with heart rate greatly improves the predictive value of exercise-induced ST−segment depression for cardiovascular disease. Inclusion of ST−segment depression with heart rate during the first minute of recovery after exercise (ST/HR hysteresis) further improves the predictive value of ST−segment depression [CIRCULATION; Kligfield,P; 114(19):2070-2082 (2006)]. The ST/HR hysteresis method of exercise ECG testing has been shown to be predictive of a more than 3-fold risk of coronary heart disease events in a Framingham study [CIRCULATION; Okin,PM; 83(6):866-874 (1999)]. Lead V5 is reportedly the most important lead in detecting coronary heart disease using ST/HR hysteresis [JOURNAL OF ELECTROCARDIOLOGY; Viik,J; 32(Suppl):70-75 (1999)].
High variation in the amplitude & shape of the ST segment & T wave is a significant indicator of sudden cardiac death risk [HEART RHYTHM; Verrier,RL; 6(3):416-422 (2009)].
![[GO TO BEN BEST'S HOME PAGE]](../homeback.gif) HOME PAGE
HOME PAGE